


If you’ve studied software engineering concepts or had some experience in designing software architectures and algorithms, you know that using diagrams to put forth ideas is key. Diagrams can put forth flow of information in an easy and understandable way. Usually when people write documentation, they end up using using tools which involve drag and drop elements to make up chart images and SVGs.
How does mermaid help 🤷🏽♂️?
One of the biggest challenges when it comes to making such diagrams is the fact that in order to change a diagram, one would most likely redraw them through the tool used earlier to come up with them. It is hard to maintain versions for diagrams. Older diagrams (Really good ones at that) are usually thrown away as a result.

Mermaid-js lets you create diagrams and visualizations by providing a markdown like syntax for creating various chart types. Mermaid allows creating several kinds of diagrams such as Flowcharts, Sequence Diagrams, Gantt Diagrams, Class Diagrams and much more.
For example if we were to generate a flow chart for calculating the Fibonacci series, the syntax for the same would look something like this:
Mermaid would take the above snippet and render the same as follows:
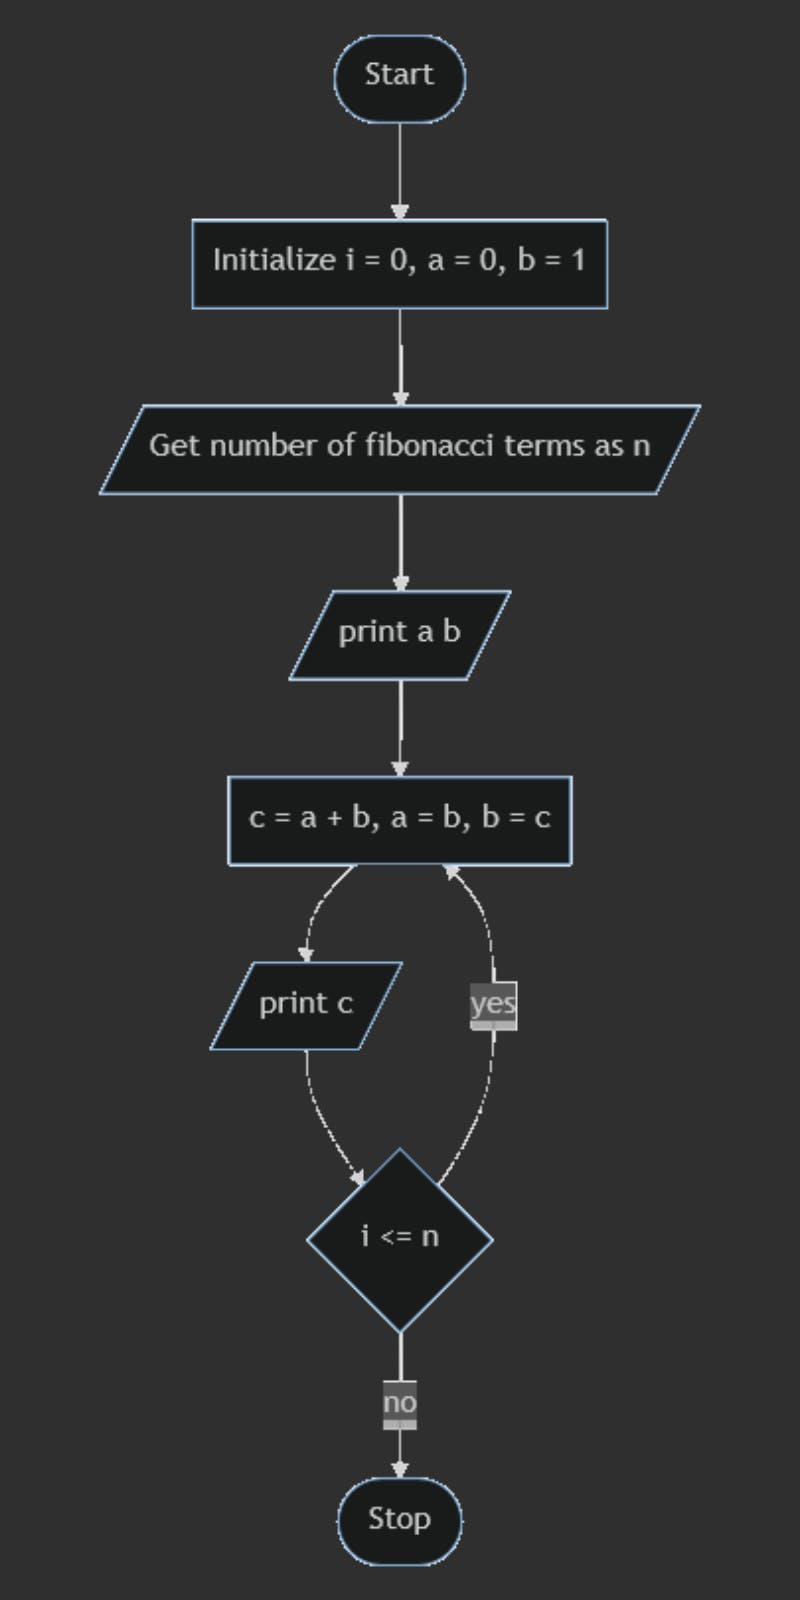

The syntax for the case of flowcharts involves typing out links between nodes referenced through ids (In the above given example the letters A through H are the ids for each node of the flowchart). The flowchart syntax shows different syntax for different shapes and even having different colors for the nodes.
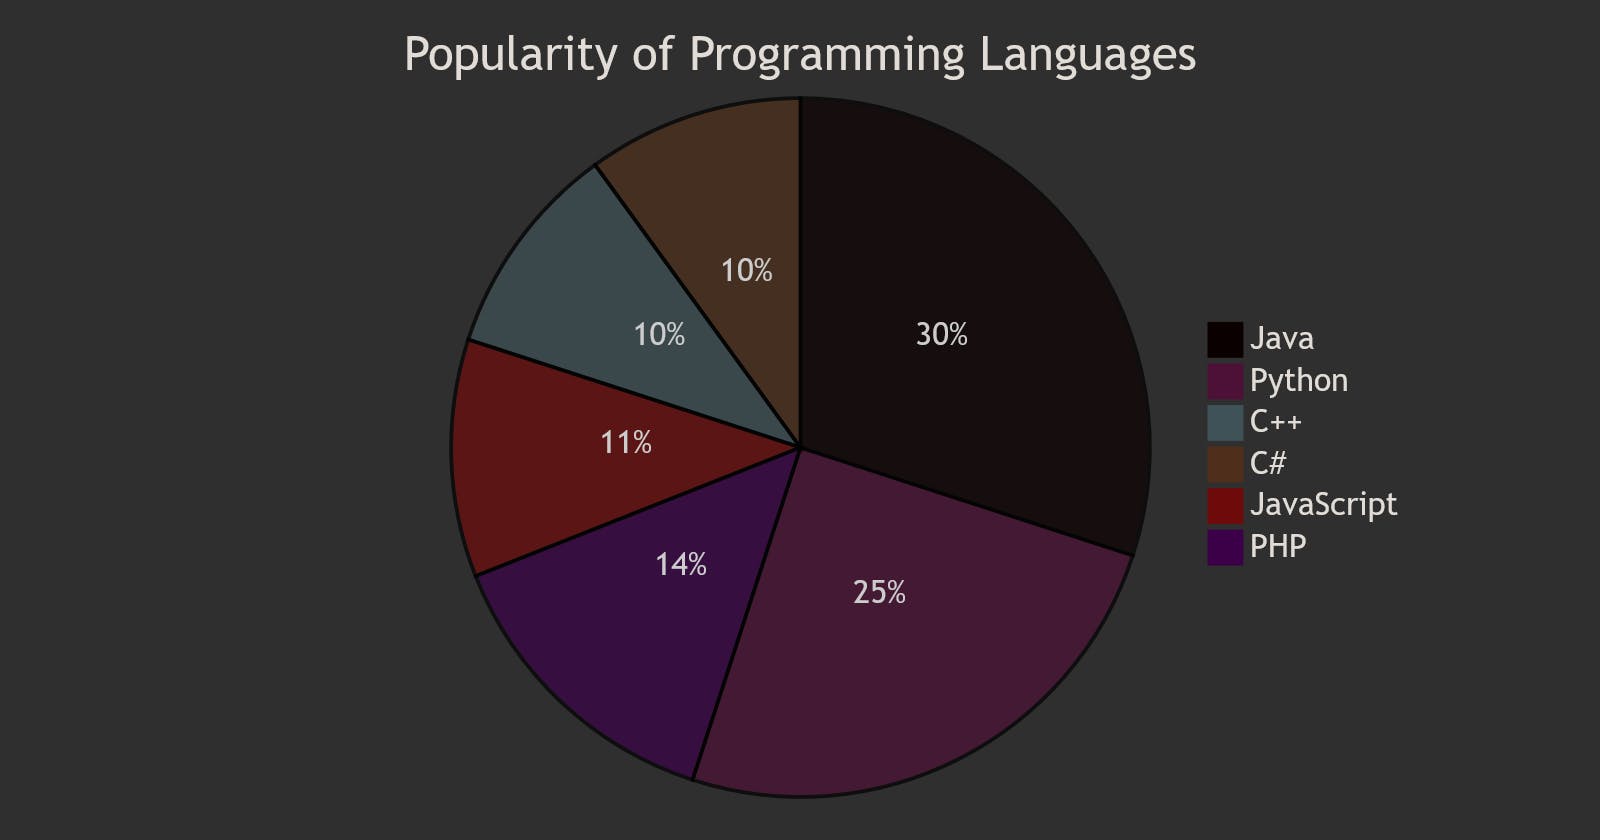
The mermaid syntax for a sample pie chart such as the following:
would make mermaid create the following chart:
Here I have shown you just a drop of vast ocean of possible diagrams and features that mermaid has to offer. To know more about exact syntax and styling for all mermaid charts can be seen here.
Maintaining Diagrams
As mentioned in the title of this article, Mermaid's approach towards generating diagrams from a text, helps us version control diagrams. Git diff would show us what exactly changed in a diagram over time. A git diff of a diagram would look something like this:
graph TB
- A[Application]---G
- B[Application]---G
+ A[Application 1]---G
+ A[Application 2]---G
  G---H
  H---E[Platform1]
  H---F[Platform2]
  G[Application Programming Interface API]
  H[Middleware Distributed Systems Services]]
From this it is easy to know what exactly changed in the diagram (In this case the labels of two nodes where renamed) and one can easily understand the history of how this diagram was changed over time.
Developing Mermaid Diagrams
Mermaid provides a live editor, where one can write the code on one side and view the diagram live on the other.
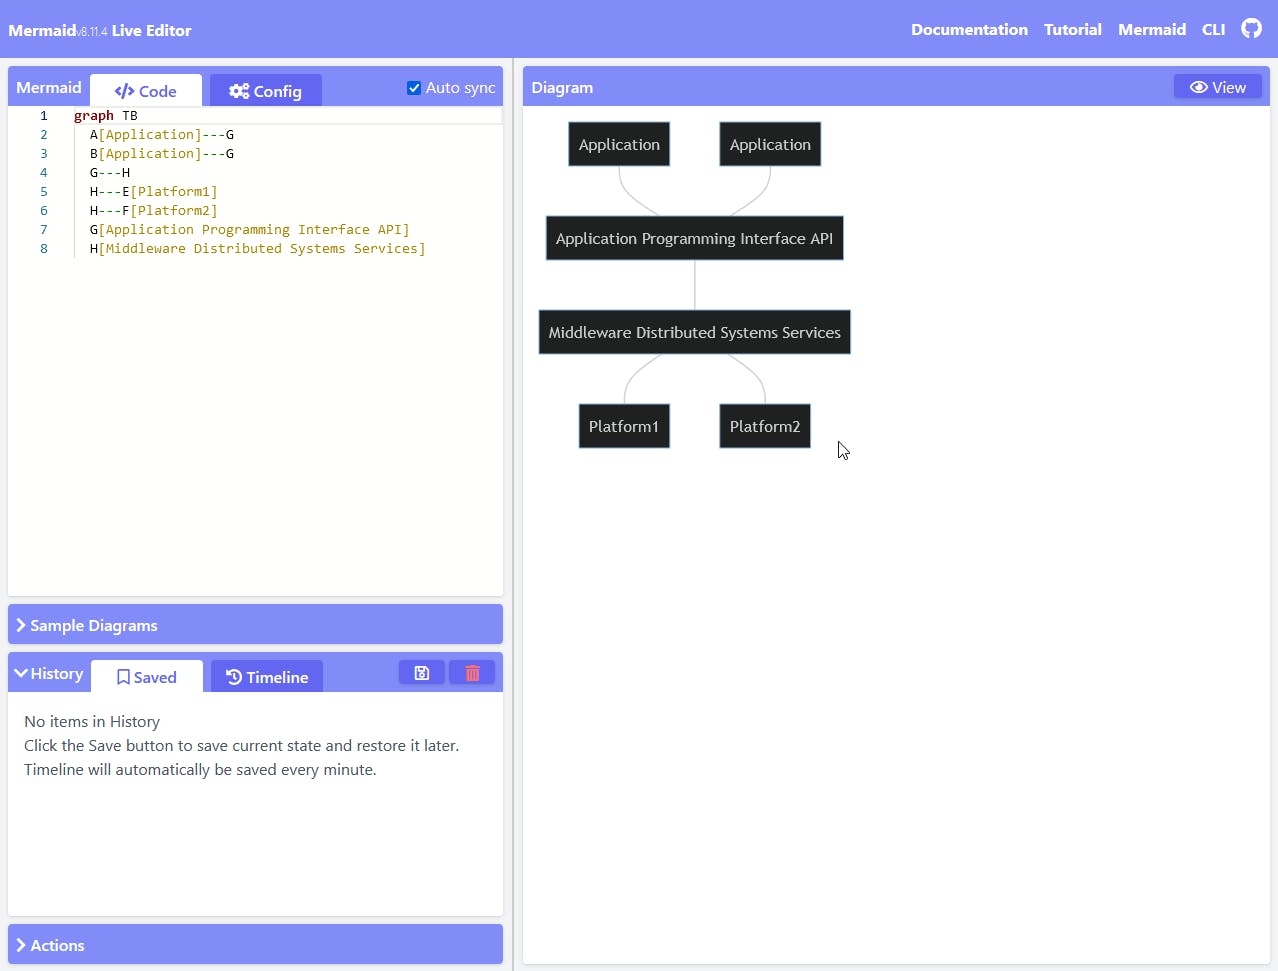
Once the diagram is designed, one can just copy the mermaid code and embed it into services that display mermaid diagrams. Services like Gitlab, Atlassian Confluence, Obsidian (To know more about Obsidian do read about it here) and several documentation site generators (Like MKDocs) all support mermaid diagrams, and do not require any extra configuration to get them working.
Hope this article intrigued you and I hope you give Mermaid a try and hopefully making diagrams might not be a chore to you now. Thanks for spending time here and let me know what you think about this article in the comments.